Introduction
The Register of foreign ownership of residential land has been established as part of the Australian Government’s commitment to increase transparency around foreign investment in Australia.
Information has been extracted from the Register to provide insights into foreign purchases and sales of residential real estate over three reporting periods. The information relates to residential real estate transactions (purchases or sales) by foreign persons over the periods 1 July 2019 to 30 June 2020 (2019–20), 1 July 2018 to 30 June 2019 (2018–19), and 1 July 2017 to 30 June 2018 (2017–18).
Consistent with Australia’s broader foreign investment review framework, the details of foreign persons are not made available publicly. Taxation law also restricts the release of information which could identify, or be used to identify, an individual or entity. For these reasons, this information is presented in an aggregated format only
Care should be taken in comparing the Insights data with the Foreign Investment Review Board Annual Reports. The FIRB Annual Reports contain proposed investment information. The Insights data reflects confirmed real estate transactions and is not a full stock take of foreign ownership in residential land.
Methodology
The Register holds information about purchase or sale transactions by foreign persons who obtained foreign investment approval.
Purchase transactions are where
- a foreign person through self-registration has indicated that they have settled on a residential property for which they had gained prior foreign investment approval, and a foreign person identified during compliance activity that has settled property and failed to apply for foreign investment approval, or
- through the collection of land titles data from participating states and territories, the ATO has matched a residential real estate transfer (purchase) and purchaser to a corresponding property and foreign person that was previously issued foreign investment approval.
Similarly, sale transactions are where
- a foreign person through self-registration has indicated that they are no longer a foreign person, have sold (and settlement has occurred on) a residential property for which they had gained prior foreign investment approval, or
- through the collection of land titles data from participating states and territories, the ATO has matched a residential real estate transfer (sale) and vendor to a corresponding property and foreign person that was previously issued foreign investment approval
For a purchase or sale transaction to be included in the Insights, the settlement date for the transaction needs to have occurred within the relevant reporting period.
For purchase transactions, if a property was purchased and then sold during the report period, the purchase is included in these figures.
The value is derived from the contract sale price and represents the transaction value at that time, not current market value.
The dwelling type vacant land, new dwelling or established dwelling reflects the type of dwelling at the time of purchase.
Understanding the reporting period
| Transactions | |
|---|---|
| Transaction starts before but settles within the reporting period | Included |
| Transaction starts within the reporting period but settles after | Not included |
| Foreign person becomes a permanent resident before reporting period | Not included |
| Foreign person becomes a permanent resident within the reporting period | Included |
2019 to 2020 Insights
Purchases
In 2019 to 2020, the total number of residential real estate purchase transactions with a level of foreign ownership was 7,482 with a value of 6.0 billion dollars.
Sales
The total number of residential real estate sale transactions by foreign persons during the 2019 to 2020 period was 1,957 with a value of 1.5 billion dollars.
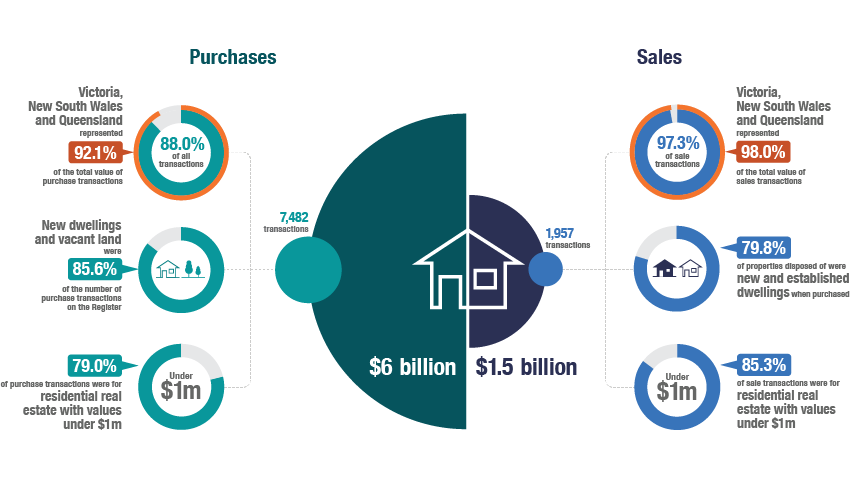
The infographic above provides the details of purchases and sales during the 2019 to 2020 years. Purchases in Victoria, New South Wales and Queensland accounted for 92.1% of the total value of purchase transactions. New dwellings and vacant land attributed to 85.6% of transactions on the register and 79% of the purchase transactions were for residential real estate with values under $1 million. 60.3 per cent of purchases occurred within 3 years of gaining foreign investment approval. This reflects the high proportion of new dwelling and vacant land property types, that can often involve long settlement periods.
In regard to sales, Victoria, New South Wales and Queensland represented 98% of the total value of sales transactions. 79.8% of the properties sold were new and existing dwellings when purchased and 85.3% of sales transactions were for residential real estate with a value of under $1 million.
Purchase transactions in 2019 to 2020
Victoria, New South Wales and Queensland represented 88.0 per cent of all purchase transactions and make up 92.1 per cent of the total value of purchase transactions recorded on the Register for the 2019 to 2020 period.
- The concentration of transactions in Victoria, New South Wales and Queensland fell slightly in 2019 to 2020 from 92.2% of all purchase transactions, making up 94.6% of the total value.
- New dwellings represented 67.8 per cent of purchase transactions, followed by 17.8 per cent for vacant land and 14.4 per cent for established dwellings in 2019 to 2020. In comparison, in 2018 to 2019, new dwellings represented 68.9 per cent of purchase transactions, followed by 17.4 per cent for vacant land and 13.7 per cent for established dwellings.
- The state with the greatest number of purchase transactions for all property types in 2019 to 2020 was Victoria. In 2018 to 2019 NSW had the greatest purchase transactions for new dwellings and Victoria had the greatest purchase transactions for vacant land and established dwellings.
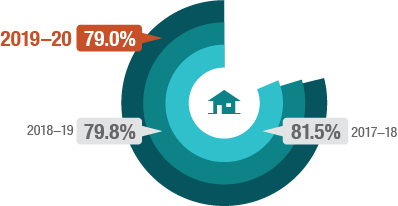
- Residential properties with values under 1 million dollars formed the majority of residential property purchase transactions, accounting for 79.0 per cent of property transactions in 2019 to 2020. This compares to 79.8 per cent in 2018 to 2019.
- Of the 7,482 purchase transactions in 2019 to 2020, 115 registrants became a permanent resident or gained Australian citizenship during the year and are included in these statistics.
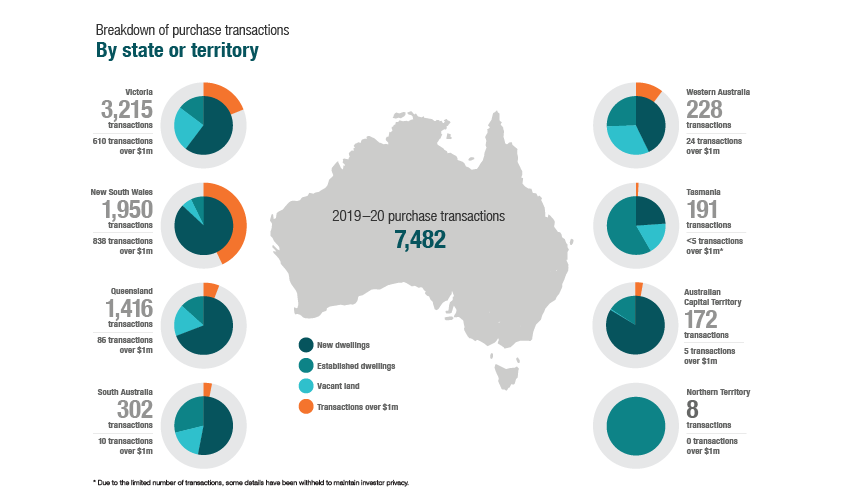
The image above provides a breakdown of purchase transactions by State or Territory across Australia. The number of transactions is as follows; Victoria: 3,215, New South Wales: 1,950, Queensland: 1,416, South Australia: 302, Western Australia: 228, Tasmania: 191, Australian Capital Territory: 172 and Northern Territory: 8.
Breakdown of 2019 to 2020 purchase transactions by property type
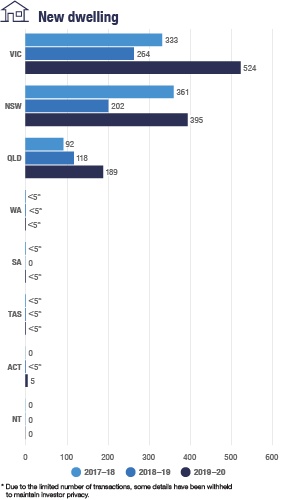
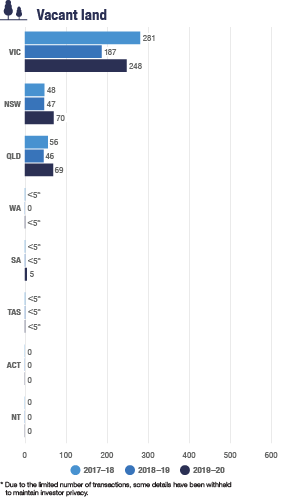
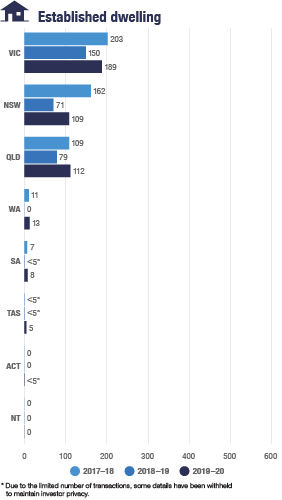
The infographics below show a breakdown of purchase transactions by property type. The three categories are new dwellings, established dwellings and vacant land.
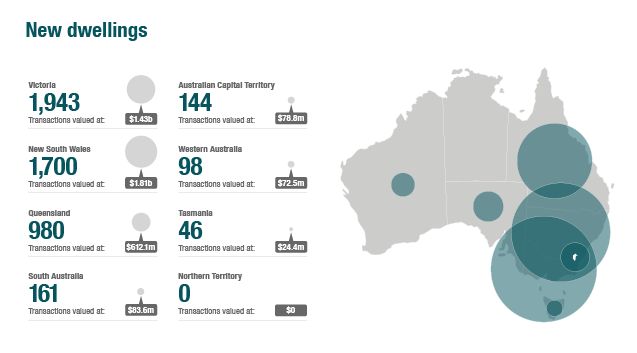

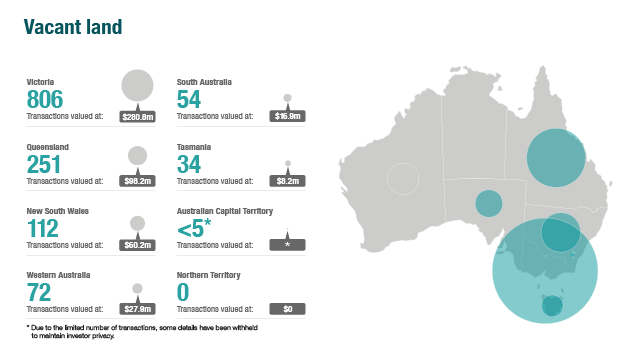
| State or Territory | New Dwellings | Established Dwellings | Vacant Land |
|---|---|---|---|
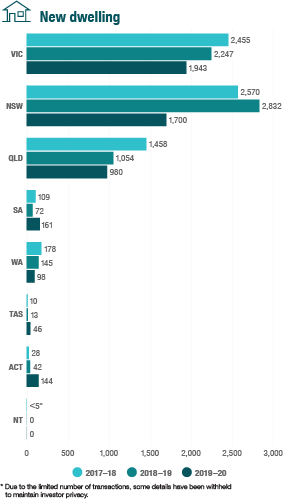
| Victoria | 1,943 | 466 | 806 |
| New South Wales | 1,700 | 138 | 112 |
| Queensland | 980 | 185 | 251 |
| South Australia | 161 | 87 | 54 |
| Australian Capital Territory | 144 | 27 | Less than 5 |
| Western Australia | 98 | 58 | 72 |
| Tasmania | 46 | 111 | 34 |
| Northern Territory | 0 | 8 | 0 |
Sale transactions in 2019 to 2020
Victoria, New South Wales and Queensland represent 97.3 per cent of all sale transactions, making up 98.0 per cent of the value of sale transactions for the reporting period.
- In comparison, in 2018 to 2019 Victoria, New South Wales and Queensland represented 99.0 per cent of all sale transactions and 99.1 per cent of the value.
- In 2019 to 2020, new dwellings represented 57.4 per cent of sale transactions, followed by 22.3 per cent for established dwellings and 20.2 per cent for vacant land. The property type reflects the type of property at time of purchase, e.g. new dwellings were new at the time of purchase.
- Victoria had the greatest number of sale transactions across all property types in both 2019 to 2020 and 2018 to 2019.
- Properties with values under 1 million dollars represented 85.3 per cent of sale transactions. This is a slight increase when compared to the proportion of sale transactions in 2018 to 2019 of 82.8 per cent.
- There are 44 sale transactions reflecting registrants who became permanent residents or gained Australian citizenship during the 2019 to 2020 report period which have been included in these figures.
- Sale transactions numbers reflect any sale transactions settled by foreign persons within the reporting period, regardless of when the initial purchase was contracted.
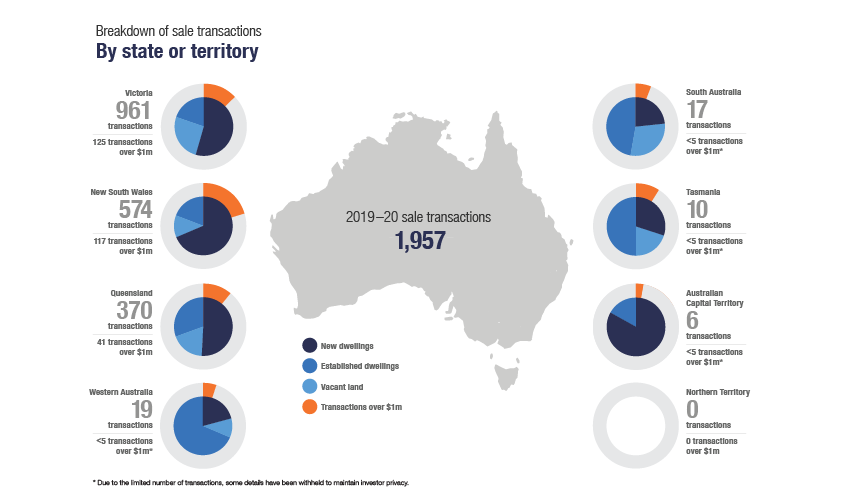
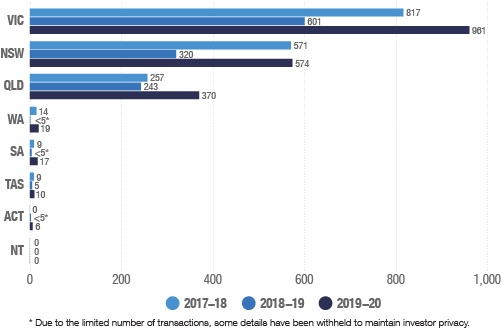
The image above provides a breakdown of sales transactions by State or Territory across Australia. The number of transactions is as follows; Victoria: 961, New South Wales: 574, Queensland: 370, South Australia: 17, Western Australia: 19, Tasmania: 10, Australian Capital Territory: 6 and Northern Territory: 0.
Breakdown of 2019 to 2020 sales transactions by property type
The infographics below show a breakdown of sales transactions by property type. The three categories are New dwellings, Established dwellings and Vacant land.
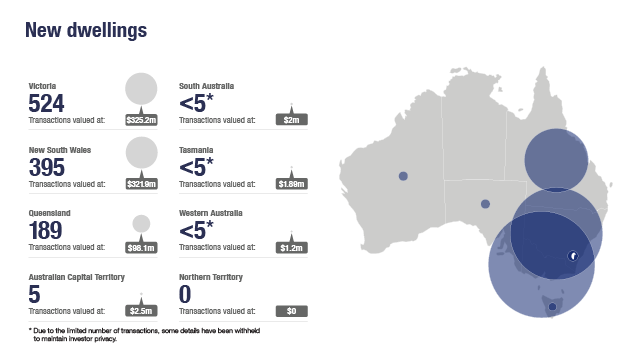

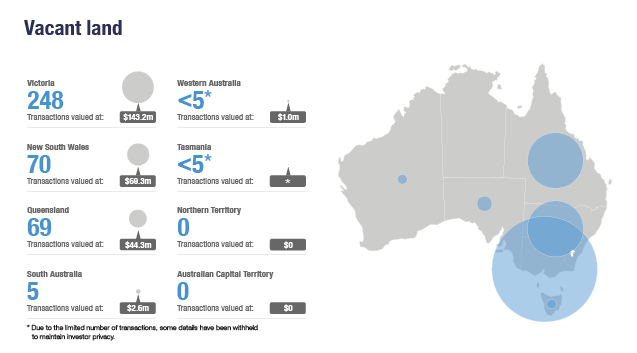
Sales transactions by property type
| State or Territory | New Dwellings | Established Dwellings | Vacant Land |
|---|---|---|---|
| Victoria | 524 | 189 | 248 |
| New South Wales | 395 | 109 | 70 |
| Queensland | 189 | 112 | 69 |
| South Australia | Less than 5 | 8 | 5 |
| Australian Capital Territory | 5 | Less than 5 | 0 |
| Western Australia | Less than 5 | 13 | Less than 5 |
| Tasmania | Less than 5 | 5 | Less than 5 |
| Northern Territory | 0 | 0 | 0 |
Three year comparison of purchase transactions
Purchase transactions have declined over the three years from 2017 to 2018 to 2019 to 2020. There was a 19.5 per cent reduction in the number of purchase transactions in 2019–20 when compared to 2018–19. The value of transactions also reduced by 19.8 per cent in 2019–20 when compared to 2018–19.

Purchase transactions by state or territory.
The ACT, SA and Tasmania show an increase in purchase counts in 2019 to 2020 when compared to 2018 to 2019. The remaining states show an overall reduction.

Purchase transactions with values under $1 million.
The percentage of purchase transactions for residential real estate with values under $1m has been stable over the 3 years 2017 to 2018 to 2019 to 2020, remaining around the 80% mark.
Comparing percentage change.
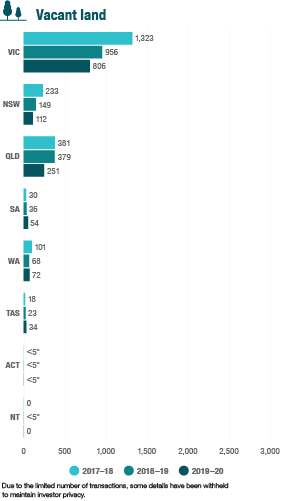
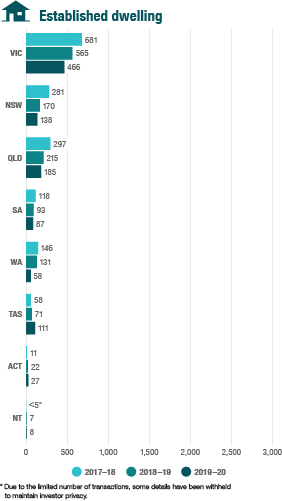
Comparing the percentage change in 2019 to 2020 purchase transactions by property type to 2018 to 2019, new dwellings had the greatest reduction of 20.8 per cent. Vacant land reduced by 17.7 per cent and established dwellings reduced by 15.2 per cent. The majority of foreign purchases on the Register were new dwellings and vacant land.
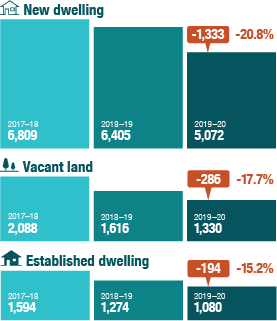
The above data can be further broken down to the State and Territory level. Purchase transaction trends by state or territory in the three years 2017 to 2018, 2018 to 2019 and 2019 to 2020 show New South Wales and Victoria had greatest number in each property type.
Three year comparison of sales transactions
Sale transactions have increased in 2019 to 2020 when compared to both 2018 and 2019 financial years. There was a 66.4 per cent increase in sale transactions in 2019 to 2020 when compared to 2018 to 2019. The value of sale transactions also increased by 49.0 per cent over the same period.

Sales transactions by state or territory.
There was an increase in sale counts when compared to 2018 to 2019 in all states and the Australian Capital Territory
Sales transactions with values under $1 million.
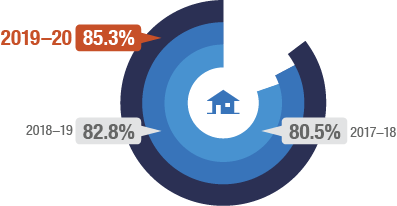
The percentage of sale transactions for residential real estate with values under $1m has increased from 80.5% in 2017 to 2018 to 85.3% in 2019 to 2020.
Comparing percentage change.
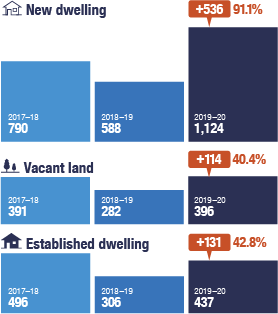
Comparing percentage change in 2019 to 2020 sale transactions by property type to 2018 to 2019, new dwellings had the greatest increase of 91.1 per cent. Vacant land increased by 40.4 per cent and established dwellings increased by 42.8 per cent. The majority of sale transactions involved properties registered as new or established dwellings.
The above data can be further broken down to the State and Territory level as seen below. Sale transaction trends by state or territory in the three years 2017 to 2018, 2018 to 2019 and 2019 to 2020 show New South Wales and Victoria had greatest number in each property type.
